
PTS (Points)
14.3
85th of 362
down from the season average: 14.1 last 10
REB (Rebounds)
7.3
31st of 362
down from the season average: 7.0 last 10
AST (Assists)
1.1
247th of 362
level with the season average: 1.1 last 10
TS% (True shooting percentage)
55.8
down from the season average: 54.7 last 10
USG% (Usage rate)
18.8
down from the season average: 18.5 last 10
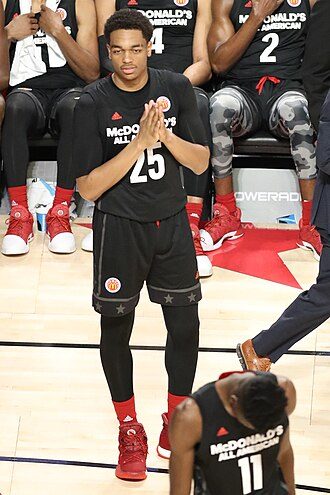
P.J. Washington averages 14.3 points, 7.3 rebounds and 1.1 assists in 12 games (32.2 minutes a game) for the Dallas Mavericks in 2026-27. True shooting 55.8% on a 18.8% usage rate. League rank: 85th of 362 in points, 31st in rebounds and 247th in assists. Last 10 games: 14.1 points, 7.0 rebounds, 1.1 assists and 32.3 minutes a game. Keel Impact −0.2. Next game: at the Cleveland Cavaliers on Nov 14, 7:30 PM EST.

Follow his games live on your lock screen — in the app



Next game

In the news
| Split | GP | MIN | PTS | REB | AST | STL | BLK | TOV | FG% | 3P% | FT% | TS% | USG% | GmSc |
|---|---|---|---|---|---|---|---|---|---|---|---|---|---|---|
| Regular season | 12 | 32.2 | 14.3 | 7.3 | 1.1 | 0.7 | 0.9 | 1.7 | 41.8 | 35.1 | 72.7 | 55.8 | 18.8 | 10.2 |
| Last 10 games | 10 | 32.3 | 14.1 | 7.0 | 1.1 | 0.8 | 0.7 | 1.4 | 40.4 | 34.3 | 76.5 | 54.7 | 18.5 | 10.1 |
P.J. Washington stats by season
Regular season, per game. Our numbers start with 2020-21.
| 2026-27 | Dallas Mavericks | 12 | 32.2 | 14.3 | 7.3 | 1.1 | 0.7 | 0.9 | 1.7 | 41.8 | 35.1 | 72.7 | 55.8 |
|---|---|---|---|---|---|---|---|---|---|---|---|---|---|
| 2025-26 | Dallas Mavericks | 56 | 30.9 | 14.2 | 7.0 | 1.8 | 1.0 | 1.1 | 1.7 | 45.0 | 32.5 | 68.7 | 53.7 |
| 2024-25 | Dallas Mavericks | 57 | 32.2 | 14.7 | 7.8 | 2.3 | 1.1 | 1.1 | 2.1 | 45.3 | 38.1 | 72.2 | 55.6 |
| 2023-24 | Charlotte HornetsDallas Mavericks | 73 | 30.4 | 12.9 | 5.6 | 1.9 | 1.0 | 0.8 | 1.3 | 43.6 | 32.0 | 68.3 | 53.7 |
| 2022-23 | Charlotte Hornets | 73 | 32.6 | 15.7 | 4.9 | 2.4 | 0.9 | 1.1 | 1.5 | 44.4 | 34.8 | 73.0 | 54.2 |
| 2021-22 | Charlotte Hornets | 65 | 27.2 | 10.3 | 5.2 | 2.3 | 0.9 | 0.9 | 1.3 | 47.0 | 36.5 | 71.6 | 58.8 |
| 2020-21 | Charlotte Hornets | 64 | 30.5 | 12.9 | 6.5 | 2.5 | 1.1 | 1.2 | 2.0 | 44.0 | 38.6 | 74.5 | 54.9 |
| 7 seasons | 400 | 30.7 | 13.4 | 6.1 | 2.2 | 1.0 | 1.0 | 1.6 | 44.6 | 35.2 | 71.4 | 55.0 |
Form
Every game is in the game log below.
Keel Impact
All ratingsPoints per 100 possessions he adds over an average player, from every lineup he played in, shrunk toward what his box score predicts. Percentiles among players with 1,000+ minutes. How it is computed
His shot making — with Pro
ProShot quality and shot making is part of Keel Stats Pro
| 2026-27 | DAL | 387 | -0.2 | +0.3 | -0.6 | 12.5 | -15.7 |
|---|---|---|---|---|---|---|---|
| 2025-26 | DAL | 1731 | -0.8 | -1.6 | +0.7 | 13.1 | -5.0 |
| 2024-25 | DAL | 1833 | +2.0 | +0.8 | +1.2 | 14.0 | +0.6 |
| 2023-24 | CHA | 2217 | -0.5 | -0.6 | +0.1 | 12.1 | +2.8 |
| 2022-23 | CHA | 2377 | -0.6 | -0.5 | -0.1 | 12.9 | -2.6 |
| 2021-22 | CHA | 1766 | +1.8 | +1.8 | +0.0 | 13.6 | +4.0 |
| 2020-21 | CHA | 1955 | +1.1 | +0.7 | +0.3 | 13.3 | +5.2 |
Dallas Mavericks teammates
- Cooper Flagg24.6 pts33.5 min
- Kyrie Irving21.6 pts30.1 min
- Zaccharie Risacher8.3 pts24.2 min
- Daniel Gafford9.1 pts21.5 min
- Naji Marshall11.3 pts24.6 min
- Max Christie5.3 pts18.4 min
- Walter Clayton Jr.7.0 pts16.9 min
- Morez Johnson6.9 pts16.7 min
Situations
ProOn/off and with/without is part of Keel Stats Pro
On/off
ProOn/off and with/without is part of Keel Stats Pro
Game log
| Result | ||||||||||||||
|---|---|---|---|---|---|---|---|---|---|---|---|---|---|---|
| , @ Minnesota Timberwolves | @ MIN | L94-133 | 16:21 | 10 | 3 | 0 | 4-7 | 1-4 | 1-1 | 0 | 0 | 2 | -14 | 4.0 |
| , vs Indiana Pacers | vs IND | W125-122 | 35:20 | 13 | 9 | 1 | 4-12 | 2-8 | 3-6 | 2 | 2 | 2 | -2 | 9.0 |
| , vs Brooklyn Nets | vs BKN | W130-93 | 24:46 | 6 | 5 | 0 | 2-3 | 2-3 | 0-0 | 1 | 1 | 2 | +17 | 5.1 |
| , vs Utah Jazz | vs UTA | W112-100 | 32:39 | 26 | 6 | 1 | 7-14 | 6-10 | 6-7 | 1 | 1 | 0 | +9 | 22.4 |
| , @ San Antonio Spurs | @ SAS | L111-112 | 39:00 | 21 | 10 | 3 | 7-18 | 3-8 | 4-5 | 0 | 1 | 1 | 0 | 16.4 |
| , vs Sacramento Kings | vs SAC | L100-115 | 37:38 | 12 | 5 | 1 | 2-9 | 2-8 | 6-8 | 2 | 0 | 2 | -13 | 8.3 |
| , vs Houston Rockets | vs HOU | W116-111 | 33:47 | 3 | 10 | 1 | 1-8 | 1-5 | 0-0 | 0 | 0 | 1 | +1 | 0.5 |
| , vs Oklahoma City Thunder | vs OKC | W120-96 | 26:33 | 18 | 9 | 0 | 7-16 | 2-7 | 2-2 | 0 | 1 | 1 | +2 | 12.0 |
| , @ Miami Heat | @ MIA | W113-109 | 40:38 | 20 | 9 | 2 | 6-15 | 4-11 | 4-4 | 2 | 1 | 3 | +5 | 16.1 |
| , vs San Antonio Spurs | vs SAS | L106-122 | 36:09 | 12 | 4 | 2 | 6-12 | 0-3 | 0-1 | 0 | 0 | 0 | -18 | 7.0 |
| , @ Indiana Pacers | @ IND | W121-105 | 33:08 | 20 | 13 | 0 | 6-11 | 2-4 | 6-8 | 0 | 3 | 2 | -4 | 17.9 |
| , @ Houston Rockets | @ HOU | L110-128 | 30:33 | 10 | 4 | 2 | 4-9 | 2-6 | 0-2 | 0 | 1 | 4 | -27 | 3.4 |