
PTS (Points)
21.3
31st of 359
level with the season average: 21.3 last 10
REB (Rebounds)
6.7
45th of 359
level with the season average: 6.7 last 10
AST (Assists)
4.1
59th of 359
up from the season average: 4.2 last 10
TS% (True shooting percentage)
53.3
down from the season average: 52.0 last 10
USG% (Usage rate)
26.9
up from the season average: 27.7 last 10
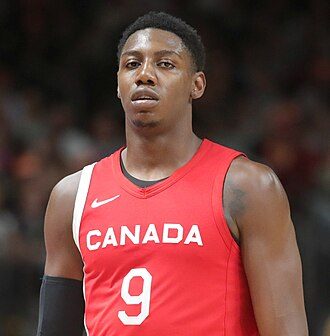
RJ Barrett averages 21.3 points, 6.7 rebounds and 4.1 assists in 12 games (33.5 minutes a game) for the Toronto Raptors in 2026-27. True shooting 53.3% on a 26.9% usage rate. League rank: 31st of 359 in points, 45th in rebounds and 59th in assists. Last 10 games: 21.3 points, 6.7 rebounds, 4.2 assists and 34.1 minutes a game. Keel Impact −0.1. Next game: vs the New York Knicks on Nov 15, 6:00 PM EST.

Follow his games live on your lock screen — in the app



Next game

In the news
| Split | GP | MIN | PTS | REB | AST | STL | BLK | TOV | FG% | 3P% | FT% | TS% | USG% | GmSc |
|---|---|---|---|---|---|---|---|---|---|---|---|---|---|---|
| Regular season | 12 | 33.5 | 21.3 | 6.7 | 4.1 | 0.5 | 0.5 | 1.8 | 46.4 | 30.2 | 62.1 | 53.3 | 26.9 | 15.0 |
| Last 10 games | 10 | 34.1 | 21.3 | 6.7 | 4.2 | 0.6 | 0.5 | 2.1 | 44.8 | 32.7 | 61.1 | 52.0 | 27.7 | 14.4 |
RJ Barrett stats by season
Regular season, per game. Our numbers start with 2020-21.
| 2026-27 | Toronto Raptors | 12 | 33.5 | 21.3 | 6.7 | 4.1 | 0.5 | 0.5 | 1.8 | 46.4 | 30.2 | 62.1 | 53.3 |
|---|---|---|---|---|---|---|---|---|---|---|---|---|---|
| 2025-26 | Toronto Raptors | 57 | 30.3 | 19.3 | 5.3 | 3.3 | 0.7 | 0.3 | 1.7 | 49.1 | 33.9 | 71.7 | 58.5 |
| 2024-25 | Toronto Raptors | 58 | 32.2 | 21.1 | 6.3 | 5.4 | 0.8 | 0.3 | 2.9 | 46.8 | 35.0 | 63.0 | 54.7 |
| 2023-24 | New York KnicksToronto Raptors | 58 | 31.7 | 20.2 | 5.4 | 3.3 | 0.5 | 0.4 | 2.2 | 49.5 | 36.0 | 71.5 | 58.0 |
| 2022-23 | New York Knicks | 73 | 34.0 | 19.6 | 5.0 | 2.8 | 0.4 | 0.2 | 2.2 | 43.4 | 31.0 | 74.0 | 53.1 |
| 2021-22 | New York Knicks | 70 | 34.6 | 20.0 | 5.8 | 3.0 | 0.6 | 0.2 | 2.2 | 40.8 | 34.2 | 71.4 | 51.1 |
| 2020-21 | New York Knicks | 72 | 34.9 | 17.6 | 5.8 | 3.0 | 0.7 | 0.3 | 1.9 | 44.1 | 40.1 | 74.6 | 53.5 |
| 7 seasons | 400 | 33.1 | 19.6 | 5.6 | 3.4 | 0.6 | 0.3 | 2.2 | 45.2 | 34.7 | 70.8 | 54.4 |
Form
Every game is in the game log below.
Keel Impact
All ratingsPoints per 100 possessions he adds over an average player, from every lineup he played in, shrunk toward what his box score predicts. Percentiles among players with 1,000+ minutes. How it is computed
His shot making — with Pro
ProShot quality and shot making is part of Keel Stats Pro
| 2026-27 | TOR | 365 | -0.1 | +0.1 | -0.2 | 15.9 | -5.2 |
|---|---|---|---|---|---|---|---|
| 2025-26 | TOR | 1726 | +2.3 | +3.0 | -0.8 | 16.9 | -1.8 |
| 2024-25 | TOR | 1868 | +0.1 | +0.7 | -0.6 | 16.4 | -5.0 |
| 2023-24 | TOR | 1839 | -0.6 | +0.5 | -1.1 | 16.2 | -1.9 |
| 2022-23 | NYK | 2479 | -0.8 | +0.3 | -1.2 | 12.8 | -14.1 |
| 2021-22 | NYK | 2419 | -1.0 | -0.1 | -0.9 | 13.7 | -16.0 |
| 2020-21 | NYK | 2511 | +1.2 | +0.5 | +0.8 | 13.4 | -0.1 |
Toronto Raptors teammates
- Ja'Kobe Walter11.1 pts30.3 min
- Immanuel Quickley17.6 pts31.0 min
- Jamal Shead6.8 pts23.9 min
- Scottie Barnes23.5 pts33.3 min
- Collin Murray-Boyles10.5 pts22.9 min
- Jakob Poeltl8.3 pts23.9 min
- Jamison Battle9.7 pts19.3 min
- Allen Graves4.6 pts13.6 min
Situations
ProOn/off and with/without is part of Keel Stats Pro
On/off
ProOn/off and with/without is part of Keel Stats Pro
Game log
| Result | ||||||||||||||
|---|---|---|---|---|---|---|---|---|---|---|---|---|---|---|
| , @ Philadelphia 76ers | @ PHI | L112-123 | 36:53 | 31 | 14 | 5 | 13-20 | 4-7 | 1-2 | 0 | 0 | 3 | -5 | 25.7 |
| , vs Boston Celtics | vs BOS | L93-98 | 31:29 | 12 | 8 | 7 | 5-16 | 0-2 | 2-2 | 2 | 1 | 2 | -22 | 10.8 |
| , vs Memphis Grizzlies | vs MEM | L102-118 | 35:31 | 19 | 3 | 2 | 7-21 | 1-6 | 4-9 | 0 | 1 | 1 | -23 | 7.5 |
| , @ Milwaukee Bucks | @ MIL | W121-107 | 36:50 | 27 | 7 | 4 | 9-21 | 0-4 | 9-11 | 0 | 0 | 4 | -2 | 16.0 |
| , @ Denver Nuggets | @ DEN | L109-128 | 33:21 | 22 | 5 | 3 | 7-17 | 3-7 | 5-8 | 0 | 0 | 0 | -15 | 14.5 |
| , @ LA Clippers | @ LAC | W125-118 | 37:09 | 26 | 6 | 3 | 10-19 | 2-6 | 4-8 | 0 | 2 | 2 | +18 | 18.0 |
| , @ Los Angeles Lakers | @ LAL | L125-131 | 32:01 | 22 | 10 | 5 | 9-18 | 4-9 | 0-0 | 0 | 0 | 3 | +9 | 16.1 |
| , vs Orlando Magic | vs ORL | L114-121 | 33:42 | 9 | 3 | 5 | 3-10 | 1-4 | 2-4 | 0 | 1 | 5 | -1 | 1.7 |
| , vs Orlando Magic | vs ORL | W129-99 | 32:10 | 25 | 9 | 6 | 9-18 | 3-7 | 4-5 | 1 | 0 | 0 | +15 | 23.1 |
| , @ Minnesota Timberwolves | @ MIN | L94-117 | 32:20 | 20 | 2 | 2 | 9-21 | 0-3 | 2-5 | 3 | 0 | 1 | -19 | 10.5 |
| , @ Washington Wizards | @ WAS | W112-102 | 33:55 | 23 | 9 | 4 | 9-16 | 1-5 | 4-5 | 0 | 1 | 0 | +3 | 22.0 |
| , vs Chicago Bulls | vs CHI | W135-92 | 26:14 | 20 | 4 | 3 | 8-14 | 0-3 | 4-7 | 0 | 0 | 1 | +34 | 13.7 |