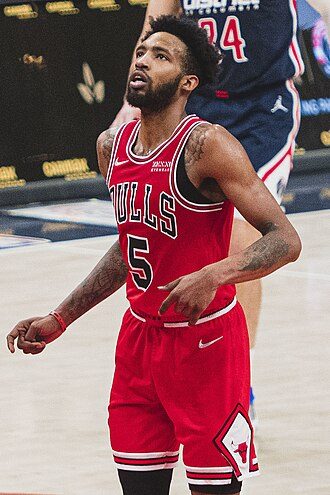

PTS (Points)
11.1
123rd of 359
level with the season average: 11.1 last 10
REB (Rebounds)
4.9
102nd of 359
level with the season average: 4.9 last 10
AST (Assists)
1.4
210th of 359
level with the season average: 1.4 last 10
TS% (True shooting percentage)
63.2
level with the season average: 63.2 last 10
USG% (Usage rate)
14.6
level with the season average: 14.6 last 10
Derrick Jones Jr. averages 11.1 points, 4.9 rebounds and 1.4 assists in 9 games (29.1 minutes a game) for the LA Clippers in 2026-27. True shooting 63.2% on a 14.6% usage rate. League rank: 123rd of 359 in points, 102nd in rebounds and 210th in assists. Keel Impact +0.6. Next game: vs the Oklahoma City Thunder on Nov 13, 10:30 PM EST.

Follow his games live on your lock screen — in the app



Next game

In the news
| Split | GP | MIN | PTS | REB | AST | STL | BLK | TOV | FG% | 3P% | FT% | TS% | USG% | GmSc |
|---|---|---|---|---|---|---|---|---|---|---|---|---|---|---|
| Regular season | 9 | 29.1 | 11.1 | 4.9 | 1.4 | 1.1 | 0.8 | 1.1 | 50.7 | 47.2 | 64.3 | 63.2 | 14.6 | 10.0 |
| Last 10 games | 9 | 29.1 | 11.1 | 4.9 | 1.4 | 1.1 | 0.8 | 1.1 | 50.7 | 47.2 | 64.3 | 63.2 | 14.6 | 10.0 |
Derrick Jones Jr. stats by season
Regular season, per game. Our numbers start with 2020-21.
| 2026-27 | LA Clippers | 9 | 29.1 | 11.1 | 4.9 | 1.4 | 1.1 | 0.8 | 1.1 | 50.7 | 47.2 | 64.3 | 63.2 |
|---|---|---|---|---|---|---|---|---|---|---|---|---|---|
| 2025-26 | LA Clippers | 50 | 27.0 | 10.1 | 3.5 | 1.4 | 0.9 | 1.0 | 0.8 | 49.9 | 35.9 | 76.3 | 60.0 |
| 2024-25 | LA Clippers | 77 | 24.3 | 10.1 | 3.4 | 0.8 | 1.0 | 0.4 | 0.9 | 52.6 | 35.6 | 70.3 | 60.9 |
| 2023-24 | Dallas Mavericks | 76 | 23.4 | 8.6 | 3.3 | 1.0 | 0.7 | 0.7 | 0.9 | 48.3 | 34.3 | 71.3 | 59.2 |
| 2022-23 | Chicago Bulls | 64 | 14.0 | 5.0 | 2.4 | 0.5 | 0.5 | 0.6 | 0.4 | 50.0 | 33.8 | 73.8 | 59.7 |
| 2021-22 | Chicago Bulls | 51 | 17.7 | 5.6 | 3.3 | 0.6 | 0.5 | 0.6 | 0.6 | 53.8 | 32.8 | 80.0 | 63.3 |
| 2020-21 | Portland Trail Blazers | 58 | 22.7 | 6.8 | 3.5 | 0.8 | 0.6 | 0.9 | 0.6 | 48.4 | 31.6 | 64.8 | 57.6 |
| 7 seasons | 385 | 21.8 | 7.9 | 3.3 | 0.8 | 0.7 | 0.7 | 0.7 | 50.4 | 34.8 | 72.1 | 60.1 |
Form
Every game is in the game log below.
Keel Impact
All ratingsPoints per 100 possessions he adds over an average player, from every lineup he played in, shrunk toward what his box score predicts. Percentiles among players with 1,000+ minutes. How it is computed
His shot making — with Pro
ProShot quality and shot making is part of Keel Stats Pro
| 2026-27 | LAC | 262 | +0.6 | +0.5 | +0.0 | 14.3 | -2.6 |
|---|---|---|---|---|---|---|---|
| 2025-26 | LAC | 1350 | +1.7 | +1.2 | +0.5 | 13.3 | +5.8 |
| 2024-25 | LAC | 1874 | +1.4 | +0.8 | +0.6 | 13.6 | +2.4 |
| 2023-24 | DAL | 1778 | +0.0 | -0.6 | +0.6 | 11.7 | -2.6 |
| 2022-23 | CHI | 893 | +0.9 | -0.1 | +1.0 | 13.8 | +12.0 |
| 2021-22 | CHI | 901 | +0.4 | +0.7 | -0.3 | 12.9 | +4.6 |
| 2020-21 | POR | 1318 | -1.1 | -0.9 | -0.2 | 11.9 | +1.7 |
LA Clippers teammates
- Darius Garland20.4 pts32.6 min
- Kris Dunn8.5 pts28.5 min
- Kobe Sanders9.8 pts24.2 min
- Rui Hachimura14.4 pts29.6 min
- Brook Lopez13.6 pts23.4 min
- Keaton Wagler12.2 pts23.2 min
- Isaiah Jackson8.1 pts20.4 min
- Gradey Dick7.3 pts15.4 min
Situations
ProOn/off and with/without is part of Keel Stats Pro
On/off
ProOn/off and with/without is part of Keel Stats Pro
Game log
| Result | ||||||||||||||
|---|---|---|---|---|---|---|---|---|---|---|---|---|---|---|
| , @ Phoenix Suns | @ PHX | L110-133 | 24:02 | 11 | 3 | 0 | 4-8 | 2-5 | 1-2 | 2 | 1 | 1 | -19 | 9.6 |
| , vs New Orleans Pelicans | vs NOP | W139-123 | 28:42 | 8 | 4 | 3 | 2-5 | 0-1 | 4-6 | 0 | 0 | 1 | +4 | 7.6 |
| , vs Miami Heat | vs MIA | L116-117 | 36:42 | 12 | 8 | 1 | 5-11 | 2-5 | 0-0 | 1 | 3 | 1 | -3 | 10.7 |
| , @ Golden State Warriors | @ GSW | L112-124 | 27:32 | 9 | 7 | 1 | 3-11 | 1-5 | 2-2 | 0 | 0 | 2 | -8 | 3.7 |
| , @ Minnesota Timberwolves | @ MIN | L101-127 | 25:57 | 10 | 1 | 1 | 4-5 | 2-2 | 0-0 | 0 | 1 | 1 | -11 | 8.4 |
| , vs Los Angeles Lakers | vs LAL | L87-103 | 27:59 | 15 | 5 | 0 | 6-10 | 3-5 | 0-0 | 4 | 2 | 2 | -5 | 15.7 |
| , @ Oklahoma City Thunder | @ OKC | L101-108 | 30:27 | 11 | 6 | 1 | 4-6 | 3-3 | 0-0 | 0 | 0 | 1 | -18 | 9.9 |
| , @ Los Angeles Lakers | @ LAL | L117-125 | 34:37 | 16 | 4 | 1 | 6-13 | 3-8 | 1-2 | 2 | 0 | 0 | -13 | 12.8 |
| , vs Sacramento Kings | vs SAC | W121-96 | 25:38 | 8 | 6 | 5 | 3-4 | 1-2 | 1-2 | 1 | 0 | 1 | +18 | 11.3 |